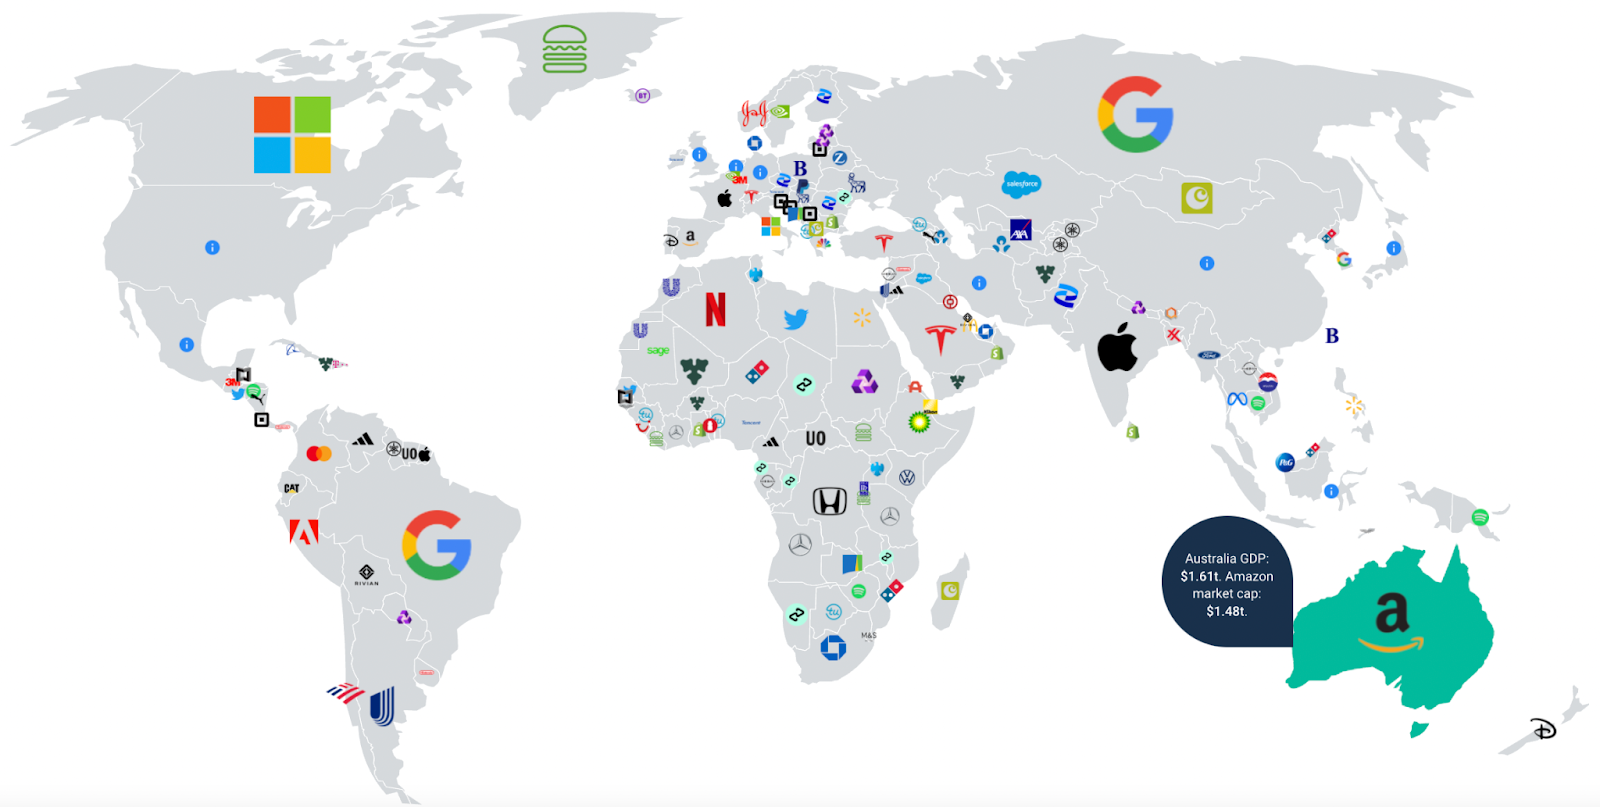
There is always a focus on how large and powerful certain companies have become and the influence they can therefore wield over governments. So, in order to try and put how much they’re worth into perspective, analysts at the personal finance comparison site, finder.com, have created a live ‘Market Cap Map.’
Q4 2021 hedge fund letters, conferences and more
Corporate Giants' Market Cap
The data and map is updated daily and compares the Gross Domestic Product (GDP) of every country with public traded companies that have the closest market capitalisation (market cap), which is the total value of all outstanding shares.
The map shows that, as of today (22nd March, 2022):
- Tesla Inc (NASDAQ:TSLA)’s market cap of $935.73 billion is closest to the GDP of Netherlands
- Apple Inc (NASDAQ:AAPL)’s market cap of $2.68 trillion is nearest to France’s GDP
- Amazon.com, Inc. (NASDAQ:AMZN)’s market cap of $1.64 trillion is closest to the GDP of Australia.
- Only 7 countries, including the UK, have a higher GDP than any company’s market cap
British companies included on the map that have similar market cap to a country’s GDP include:
- Rolls-Royce Holding PLC (LON:RR) market cap of $10.42bn is similar to Rwanda’s GDP of $10.4bn
- Aviva plc (LON:AV)’s market cap of $20.69bn is close to Afghanistan’s GDP of $19.94bn
- M&S’s market cap of $4.09bn isn’t far off Eswatini's GDP ($4.64bn).
Experience the live map on this dedicated page: https://www.finder.com/uk/market-cap-map


