Logica Capital commentary for the month ended December 31, 2022.
Summary
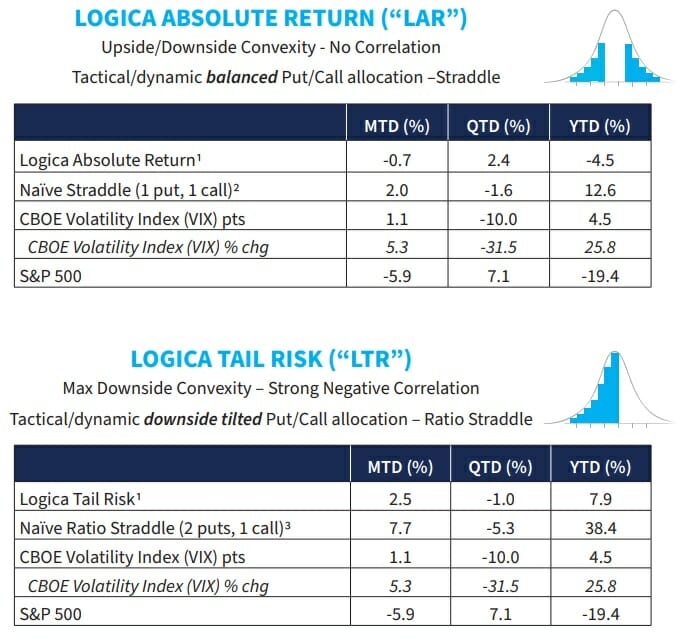
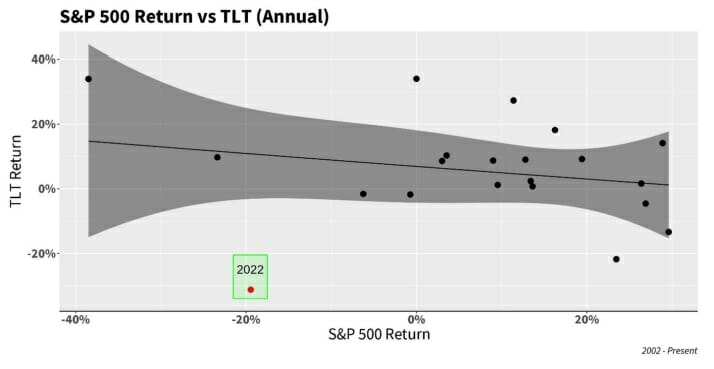
In what ended as the S&P 500’s worst calendar year return since 2008, 2022 (and December 2022) displayed a consistent theme: the S&P 500 and other indices trailed significantly downward, but without the expected gain in VIX/Implied Volatility. Also of note: stocks and bonds exhibited a historically uncommon relationship, both plunging together in an extreme fashion.
Q4 2022 hedge fund letters, conferences and more
Commentary & Portfolio Return Attribution
“Details create the big picture.”
– Sanford Weill
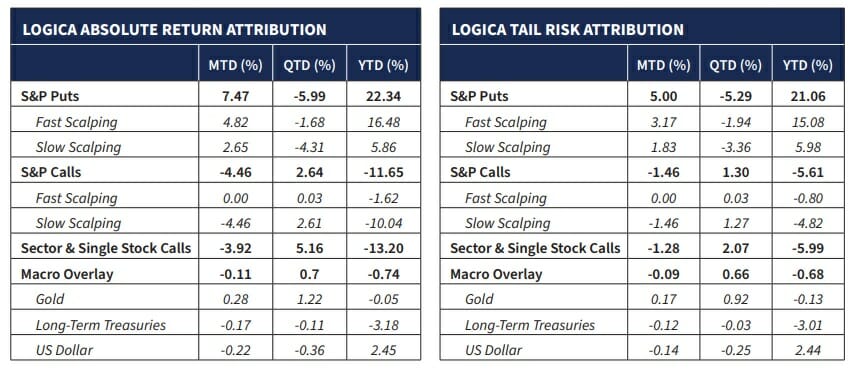
Most of our modules performed about as expected for 2022. Of particular note, our Macro Overlay held steady despite the continued sell-off in long-term bonds in December (and -31.2% YTD). Though calendar data is sparse for an annual perspective, we illustrate below how abnormal this relationship was for 2022 vs the “recent” 20 years.
From a high level portfolio wide perspective, and in addition to many internal more granular evaluations of the alpha we generate from our Delta and Vega scalping, we can very clearly see that both LAR and LTR “outperformed” what their average delta exposure for the year would have directly resulted in (e.g. an average delta exposure of +50% would be expected to lose half of what the S&P 500 declined over the year). But as we materially outperformed our average Delta exposure, we’re happy with the empirical confirmation that our edge remains intact.
The star of the year, however, was the “diversified” bucket of our Sector & Single Stock Calls. This is a sizeable portion of our overall call exposure, and a module that we rely on to generate a unique source of alpha. In 2022, our Logica Focused Diversified (LFD) module was -15.8% as a standalone long-only strategy as compared to -19.4% for the S&P 500, -33.0% for the NASDAQ 100, and -21.6% for the Russell 2000. What’s even more satisfying is that this return comes on the heels of outperformance in 2021, which of course was a large upward move in the broader market (LFD was +27.1% compared to the S&P 500 coming in at +26.9%). Our selection process thus continues to provide excess up-capture over the market through highly differentiated market regimes.
“Learn from yesterday, live for today, hope for tomorrow.
The important thing is not to stop questioning.”
– Albert Einstein
All that said, and as usual, we take a pat on the back for what we did right alongside humility toward what we didn’t do so well, consistently focused on ways we can improve. The important things, says Einstein, is not to stop questioning, and by golly, we don’t! In fact, the ironic thing about “quant” is how it seems like one can just build a model, press the button, and watch it run forward. Where in fact, constant iteration is required inside the nonlinear dynamic environment that financial markets offer us. In our view, Quant is not so much about building a systematic model, but more about establishing systematic processes for testing and innovating around a quantitative thesis. And to do so, of course, requires relentless questioning of the things that didn’t work as well, and of the things that should’ve worked better – effectively, we seek to optimize empiricism with humility.
In doing much of this analysis over the course of 2022, we are to a great degree prouder of some of our R&D results than of the current processes that we already deploy and that performed well, primarily because we can continue doing what we did to perform, but in addition, can improve the things that didn’t perform as expected. As an easy and relevant example, our continued talk in our letters about Implied Volatility not behaving as it had historically led to a tightening of our lookback window within our Vol forecast model. A long-term distribution of Vol behavior was almost irrelevant in 2022, so something like a multi-year window became less effective, while a shorter lookback at “local” Vol, did a far better job at capturing the market’s expected behavior. Accordingly, we narrowed the window, and looked more extensively into the data around varying lookback windows.
As we reviewed and analyzed, and further understood the delicate relationship between regime and forecast, the question arose… how do we modulate the look-back function, or even better, how do we build a decisiontree – and/or quantification – around the expansion or contraction of the look-back window; simply, how do we systematize our innovation? This then led us to the more general question around frequencies, and how “look-back” windows effect “trade forward” windows, wherein the size of the historical dataset has strong association with the forward extrapolation. In other words, by continuous questioning (particularly of the things that don’t go so right or work as well as expected), we isolate a variable that matters, improve our process around that variable, and finally, build more robust quant to better extract value out of that variable, and potentially, associated variables within its range of influence. And all the while, we are relentless in protecting ourselves from overfitting. In sum, “pushing the button and watching it work” is a quant myth, while constant questioning and innovation is the stark reality.
“The extreme always makes an impression.”
– Jeff Hardy
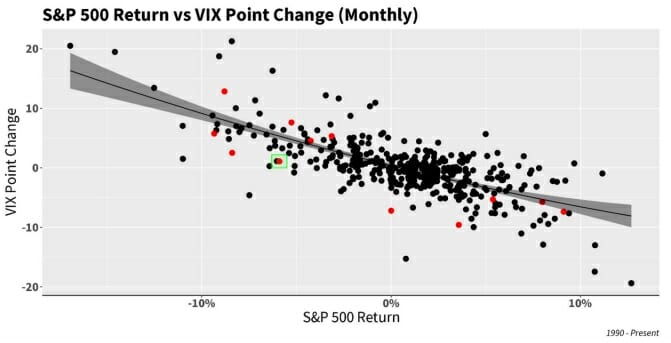
Keeping with the year-long theme of 2022, December’s S&P/VIX relationship once again fell far short of normal/expected (red dot in green box below for Dec, all red dots for 2022):
Expectedly, December brought us several anomalous VIX/S&P 500 days. On 12/19, we saw a highly irregular relationship. The following 3 charts illustrate 1, 2, and 3 day rolling periods of the VIX/S&P 500 relationship, from 1990-Present, with the criteria that VIX came from a specific level (this is a necessary variable to take into account because we would, of course, expect VIX to do something very different given a -4% S&P 500 move over 1, 2, or 3 days if VIX started its journey at 21 vs. if it were already elevated to, say, 40, with the general understanding that the higher it is already, the more reversion pressure it sits with):
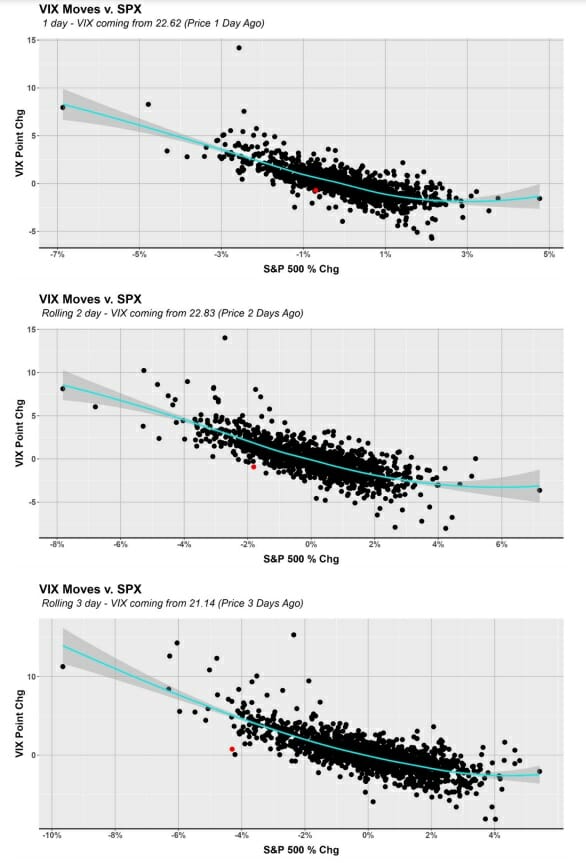
The interesting conclusion, as seen visually, is how much worse the behavior gets as the days accumulate. The 3-day outlier is worse than the 2-day which is worse than the 1-day. Similarly, and extending this concept to the widest reasonable window with respect to the current YTD drawdown in the S&P 500, we see more of the same of what we’ve been describing all year long: a measured drawdown with minimal IV upside reaction in relation to the extent of S&P’s downside, and then alongside that, larger than normal IV crush during interim equity market upside moves. December did nothing to change this phenomenon, as we can clearly see by the black dots below:
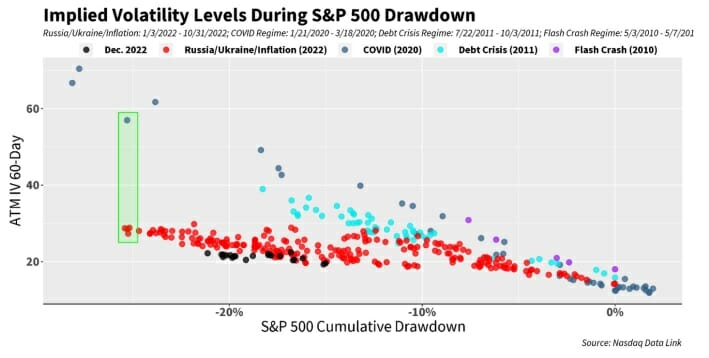
Expanding out to an even wider view, we can return to a chart we introduced in a prior letter, which draws parallels between the 2022 drawdown and the 2000-02 drawdown period, with respect to implied volatility/ VIX:
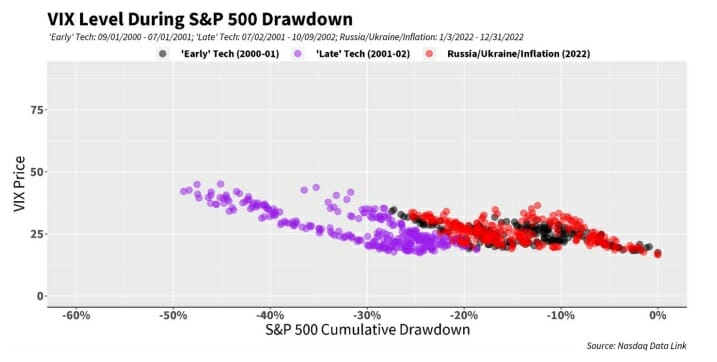
Updating another chart – in that same letter, we also drew comparisons with the “early” Great Financial Crisis (GFC) – in juxtaposition/contrast with the “late” GFC:
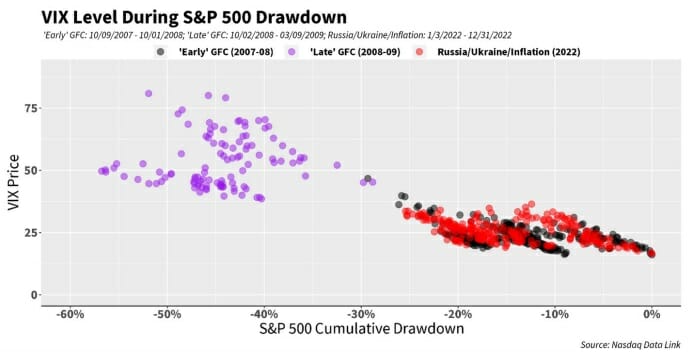
Relatedly, the CBOE VVIX Index closed the year at its lowest point (77.05) since February 2019. Moreover, since 2015, it has closed lower than this only 14 times (out of 2000+ days), the lowest close being about 4 points away at 73.18.

*The VVIX Index, outside of some mathematical gymnastics, can basically be thought of as “volatility of volatility,” or, how much implied volatility itself (VIX, in this case) is bouncing around. If implied volatility is not bouncing around (as represented by a lower value of VVIX), there are typically fewer trading opportunities for those that scalp Vega, as Logica does.
This VVIX explanation is somewhat simplified for the sake of clarity of communication, and we encourage readers that are so inclined to take a look at its full methodology for themselves: https://www.cboe.com/us/indices/dashboard/vvix/
“Strategy is a commodity; execution is an art.”
– Peter Drucker
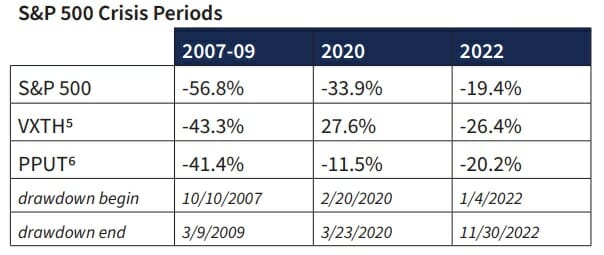
Separately, every so often in our letters we have been keeping track of a couple of products/indices that use volatility as a hedge for long positions: one product through VIX Calls, and the other using S&P 500 Puts – and both of which use OTM options as their long volatility component. Both products below were down significantly in December, and despite the fact that they contain options as a hedge, the products as a whole – ironically — were down more than the S&P 500 itself in 2022.
Separate to those indices shown above, it is noteworthy to see the 2022 experience of the publicly traded tail risk products (based on fund NAV):
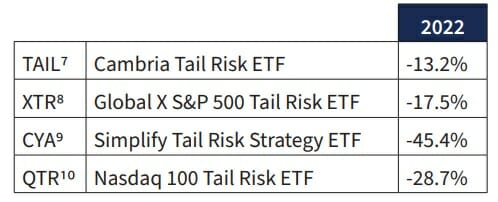
The point here is to highlight the incredible difficulty of long volatility given the behavior of 2022’s declining market (and lack of implied volatility pop) as compared to other crisis periods – and especially with regards to out-of-the-money (OTM) protection that embeds the additional risk of skew compression, as is the case with some of these products.
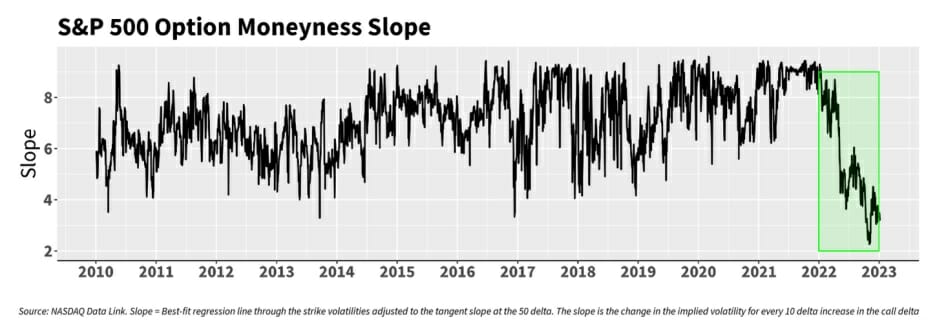
On that front, and again updating a prior chart, below we can see that the skew compression trend is continuing and the slope of the moneyness “curve” has severely flattened, meaning that the IV of OTM isn’t as elevated as normal as compared with ATM. Perhaps there is an opportunity there to buy into this “relative” cheapness, but we can certainly say that given all the above, we are acutely aware that skew exposure, and out-of-themoney option strategies in general, did not work well in 2022.
A university professor went to visit a famous Zen master. While the master quietly served
tea, the professor talked about Zen. The master poured the visitor’s cup to the brim, and
then kept pouring. The professor watched the overflowing cup until he could no longer
restrain himself. “It’s full! No more will go in!” the professor blurted. “This is you,” the
master replied, “How can I show you Zen unless you first empty your cup?”
– Zen parable
So, as we sit here at the close of 2022, and onset of a new year, we are left to wonder if there’s a “late GFC” on the horizon, or merely more of the same grind, as happened in the “late Tech” (2001/2-ish) period. More broadly, what should one do if one doesn’t know in what fashion (or even, if…) the drawdown will proceed?
We surmise that in order for the above strategies/products to have been successful in a 2022 type drawdown, they likely would’ve needed immense timing skill/luck, e.g. they are highly path dependent. In our view, while we certainly have timing/scalping/monetization components – and related alpha generation — in the strategies and models we build and implement, we don’t want the success of our strategies to be immensely reliant on these factors, or how they react to a particular regime. Above all, we want path independence.
This should be nothing new to our regular readers: we speak at length on the differences in types of protections, from out-of-the money to at-the-money, to “short the belly, long the tail” relative value volatility strategies, and everything in between. We continually “empty our cup” and approach the problems and possibilities with fresh eyes, aiming to build strategies that can be robust to a multitude of possible paths. As we see it, for those who have long equity or beta exposure, and look to us with a need to hedge, our ultimate goal is reliability – to be there whenever, and whatever, should happen.
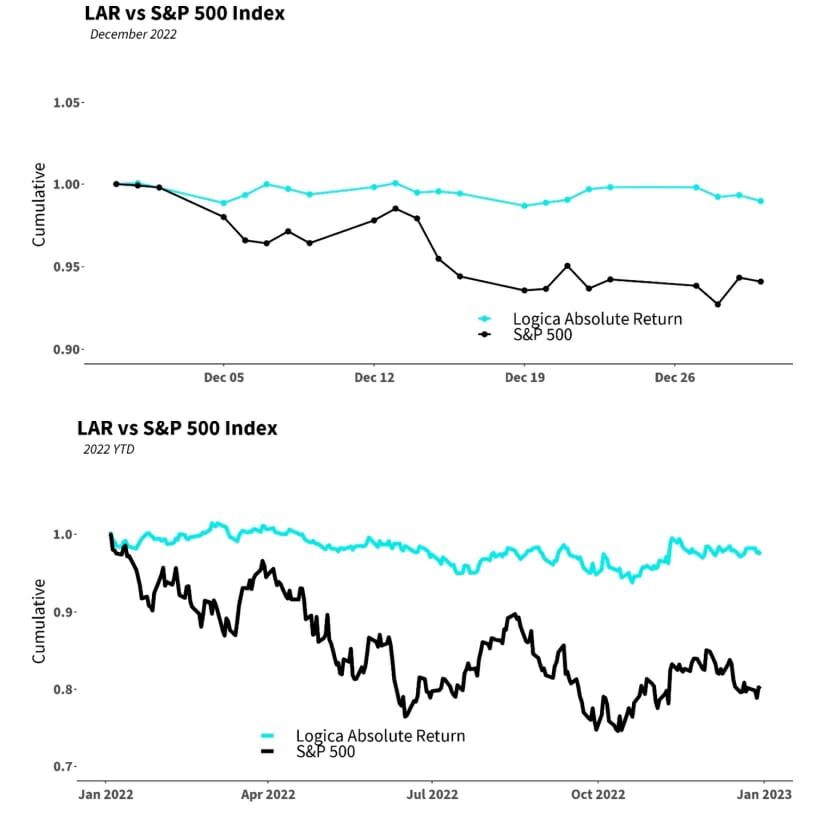
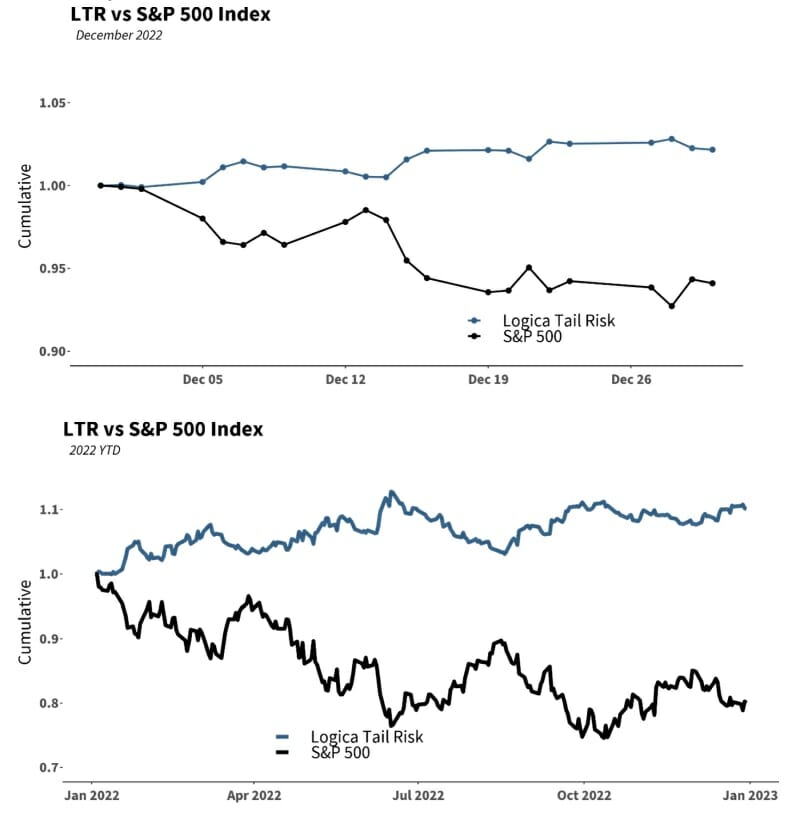
Finally, taking a closer look at the daily movement of our strategies for the month of December and the 2022 calendar year, we can see that LAR was able to remain uncorrelated in the face of a declining S&P 500 and non-responsive VIX/IV environment, while LTR predictably showed a negative correlation/ opposing behavior throughout the entirety of 2022:
Finally, taking a closer look at the daily movement of our strategies for the month of December and the 2022 calendar year, we can see that LAR was able to remain uncorrelated in the face of a declining S&P 500 and non-responsive VIX/IV environment, while LTR predictably showed a negative correlation/ opposing behavior throughout the entirety of 2022:
Follow Wayne on Twitter @WayneHimelsein

